How Many Email Users Are There In 2024? (21+ Email Usage Stats)
How many email users are there?
In this post, we’ll be looking at email usage statistics to help you gauge the number of email users there are on the internet.
Over the past few years, we’ve seen email usage rise. This gave way to more active email users on desktop and mobile devices.
If you want to see where email usage is headed, you’ll want to pay close attention to these email usage statistics.
Editor’s picks
- The number of emails sent per day will reach 378 billion by 2025. (The Radicati Group)
- 90% of those who are in the 15-25 age group in the US are active email users. (Statista)
- 60% of consumers sign up for brand emails to get updates on promos and discounts. (OptinMonster)
- In 2020, the average email open rate is 21.3%. (SuperOffice)
- Apple Mail has a market share of 40%, making it the largest email client as of 2020. (T4)
Key email usage statistics
The following email usage statistics shows you just how important emails are in our daily life. These email user stats will reveal just how big the email industry is these days.
378 billion emails are expected to be sent and received per day by 2025.
According to a 2020 assessment by The Radicati Group, the number of business and consumer emails sent per day will reach 319 billion by 2021. And by the end of 2025, that number is expected to reach 378 billion.
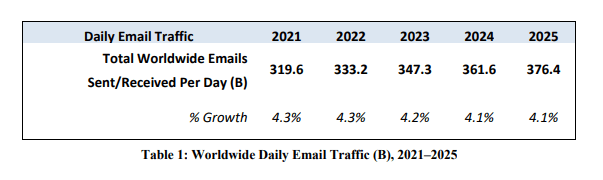
The number of email users worldwide was expected to top 4.1 billion in 2021 and is expected to grow to 4.5 billion by the end of 2025.
Source: The Radicati Group
The email market industry is expected to hit $73 billion by 2023.
The projected email market share for 2022 is $64 billion. This was higher than 2021’s $55 billion which was already an improvement over 2020’s $47 billion.
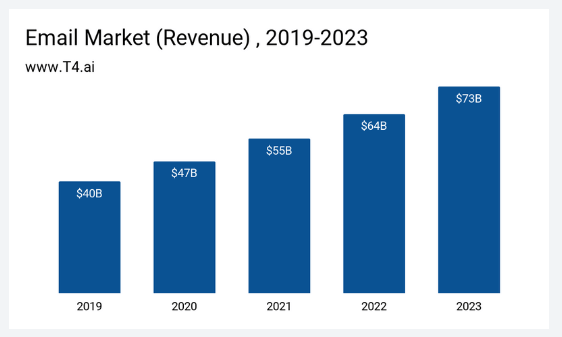
The email industry is expected to reach $734 billion by 2023.
Source: T4
Email still prevails social media, but only slightly.
OptinMonster’s email usage statistics show that there are more email users than there are social media users. In the 15-24 age group, 91% use emails versus 88% that use social media.
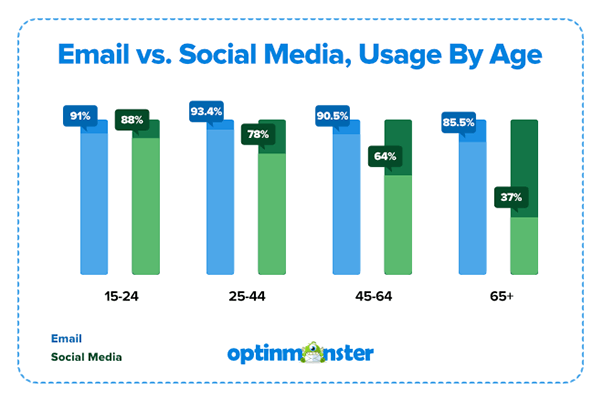
The 25-44 age group has 93.4% email users compared to the 78% that use social media. The 44-64 age group has 90.5% email users versus 64% social media users.
The 65+ group has 85.5% email users and 37% social media users.
Source: OptinMonster
93.6% of age 25-44 are active email users in the US.
90% of those who are 15-25 in the US are active email users. That percentage is slightly higher for those in the 25-44 age bracket at 93.6%.
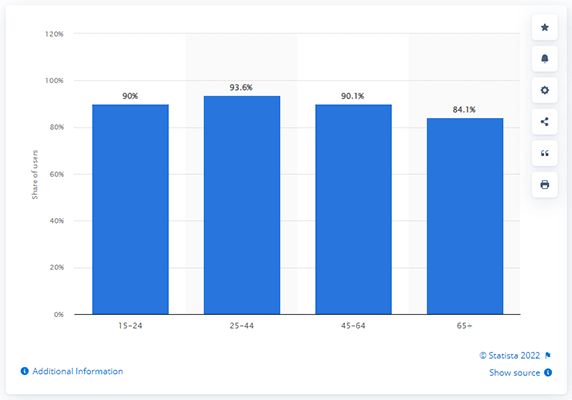
90.1% of those in the 45-64 age bracket still use emails. And 84.1% of those 65 and over in the United States still use emails.
Source: Statista
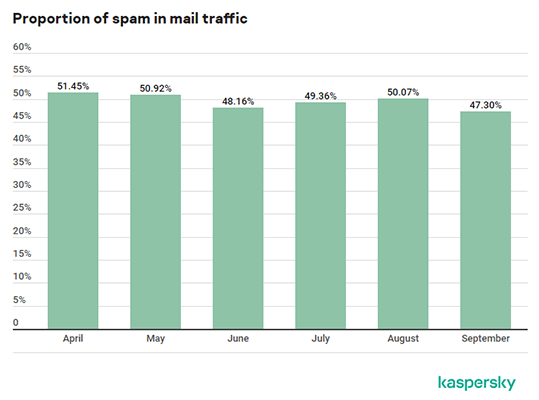
Russia sends the most spam emails.
In Q3 of 2020, the average spam emails caught in the global email traffic was 48.91%. August had the largest share of spam emails at 50.07%.
Russia appears to be the biggest source of spam emails at 23.52%. This is followed by Germany at 11.01% and then by the US at 10.85%.
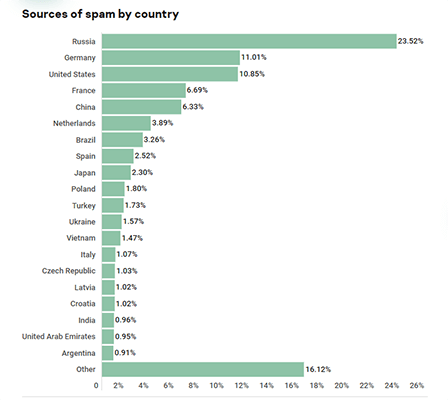
Source: Kaspersky
The average length of an email is 434 words.
According to AWeber’s email usage statistics, the average email length is 434.48 words. An email that long will typically take 3.3 minutes to read.
However, out of 1,000 emails, more than half of them (or more than 50%) were only 300 words. That means more than half of email users are learning to send shorter emails.
Emails that are packed with information do exist though. 24.1% sent emails that were 601 words or more. 11.4% sent emails that had more than 901 words.
Source: AWeber
Email marketing statistics
These figures are focused on email marketing, especially for business professionals that want to see better returns on their respective email outreach campaigns.
You want to maximize your emails to reach email users worldwide — or at least as many as possible. By understanding these email marketing stats, you’ll be able to launch a strategy that that accelerates growth.
Emails generate more sales than social media.
Email usage statistics show that emails generate more sales than social media. 60% of consumers sign up for brand emails to get updates on promos and discounts. Only 20% of users follow brands on social media for the same reason.
In addition, 44% of users will check business emails from brands they follow to find deals. Only 4% of users will check Facebook to do the same thing.
60% also said that they made purchases as a result of finding deals from business emails. Only 12.5% of social media users bought a product after seeing it on social media.
Source: OptinMonster
65% of email users want emails with discounts and special offers.
65% said they want to find a clear transactional link like discounts and special offers. 59% said they want to receive email receipts. 43% want advanced notice of new products and services.
When asked what they liked about the emails they received from brands, 52% said they liked getting offers. 50% admired how relevant the emails were. 36% liked how the email contained useful information or news.
Source: DMA
Email marketing campaigns cost anywhere between $100-$1,000 CPM.
According to ActiveCampaign, an email marketing campaign can cost anywhere between $100 and $1,000 CPM (or cost per mille which is the price for 1,000 email addresses).
A consumer list will cost $100 to $400 CPM while a business list will cost $600 to $1,000 CPM.
Source: ActiveCampaign
Email open rate statistics
No matter how many email addresses you send your emails to, that won’t matter if they’re left unopened by the recipients. You want to have more than half of your recipients interact with your email in some way.
But how?
The following email marketing open rate statistics will give you an idea.
21.3% is the average email open rate.
In 2020, the average email open rate is 21.3%. It should be noted that this percentage is lower than 2019’s figure.
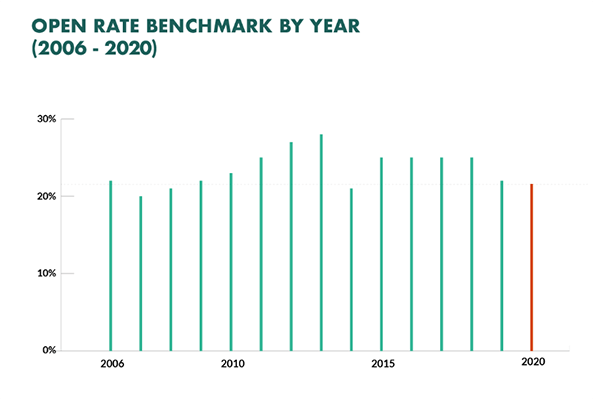
Open rates tend to differ from country to country. SuperOffice launched an email marketing campaign in 2020. And based on its results, Denmark seemed to have the best open rate at 31%. The United Kingdom didn’t fare as well as it only resulted in a 13% open rate.
Source: SuperOffice
Brand recognition affects open rate.
The most important factors that lead email users to open an email are brand recognition (55%) and the subject line (48%). That’s why you might want to try personalized subject lines. This will help improve your open rate.
Source: DMA
The highest email open rate is the real estate industry with 26%.
The real estate industry has the highest open rate at 26%. It is followed by the education industry at 25%. Internet users also seem to favor opening emails from the manufacturing industry at 23%.
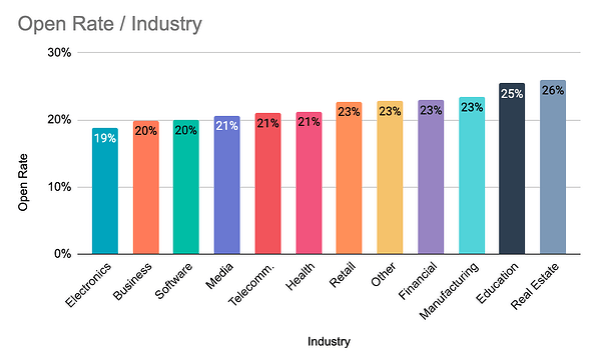
Other industries worth mentioning include financial (23%), retail (23%), health (21%), telecommunications (21%), media (21%), software (20%), business (20%), and electronics (19%).
Source: HubSpot
Email hosting platform statistics
The email hosting platform you use is also important. Should you have Gmail accounts? Or should you set up email accounts on other platforms?
What should you know when you set up business email accounts?
Here are a few critical stats on email hosting platforms to guide you.
Apple has the biggest email client market share.
Apple Mail has a market share of 40%, making it the largest email client as of 2020. However, Gmail isn’t far behind at 38%.
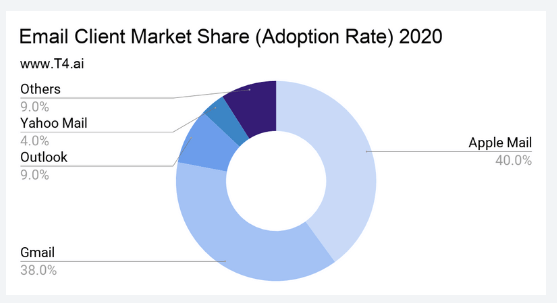
Microsoft Outlook has 9% of the market while Yahoo! Mail has 4%. Other email clients have a combined email market share of 9%.
Source: T4
Gmail has the highest usage among websites at 19.7%.
Gmail has the biggest usage among websites at 19.7%. It is followed by Microsoft at 12.3%.
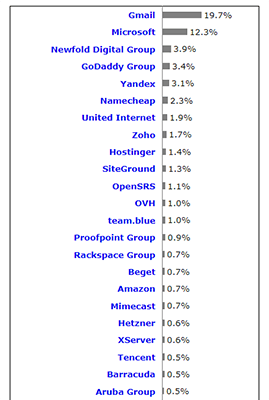
It is then followed by Newfold Digital Group (3.9%), GoDaddy Group (3.4%), Yandex (3.1%), Namecheap (2.3%), United Internet (1.9%), Zoho (1.7%), Hostininger (1.4%), SiteGround (1.3%), and OpenSRS (1.1%).
Other email service providers had a usage percentage of 1% or lower.
Source: W3 Techs
G Suite is the top email hosting provider for the top 10K sites with 28.62%.
G Suite is the top email hosting provider technology as 28.62% of all websites are using the product. It is followed by Microsoft Exchange Online at 16.14%. Yandex Mail is third at 1.27%.
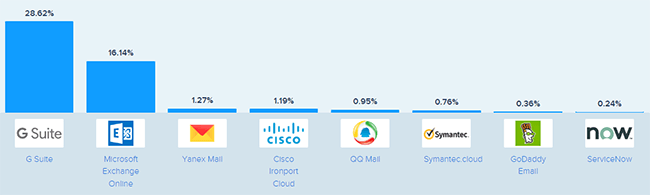
Cisco Ironport Cloud has 1.19% while QQ Mail has 0.95%. Symantec (0.76%), GoDaddy Email (0.36%), and ServiceNow (0.24%) also made the list.
Source: SimilarTech
Sources
Final thoughts
There you have it, 21+ statistics all about email usage.
Despite the numerous ways of communication, the email marketing industry still continues to grow. Even though social media has taken over our lives, there are still more people using emails compared to social media.
Emails are still vital for finding leads and generating more sales for your business. People are more likely to sign up to a brands newsletter for deals and discounts as well as make a purchase after reading an email from a brand, compared to seeing them on social media.
Think about it: if you want to sign up for a social media profile or any other account online – you need an email address.
If you’ve found these statistics interesting, check out our other roundups: