Use our net worth calculator below:
What is net worth?
Net worth is essentially everything you own (your assets) deducted by everything you owe (your liabilities). It is a useful way to determine where you stand financially.
Assets - liabilities = net worth
Your assets include everything that has been paid for such as: property, vehicles, jewellery, household items, to cash you’ve accumulated in savings accounts and your retirement fund etc.
Your liabilities are items which you still owe money on such as: mortgage, car loans, student loan, and debts for friends, family and credit cards etc.
How to calculate your net worth
To calculate your net worth all you need to do is make a list of all your assets and their value, this total figure shows you your gross worth. Then make a list of all your liabilities and how much you still owe on each one, this figure is then deducted from your gross worth to give you your net worth.
For example here are a list of assets:
- Property – $200,000
- Savings account – $12,500
- Retirement funds – $5,000
- Personal items of value (guitars & gear) – $35,000
Total assets came to $252,500.
Here are a list of liabilities:
- Car loan – $14,000
- Student loan – $8,500
- iMac loan – $4,500
Total liabilities came to $27,000.
Therefore, we deduct $27,000 from $252,500 and our net worth is $225,500.
How does your net worth compare to others?
Although money isn’t a topic commonly discussed between individuals on a casual basis, governments do provide statistics on the average earnings of households.
Here we have a wealth and assets chart curated by the UK Office for National Statistics between April 2016 and March 2018:
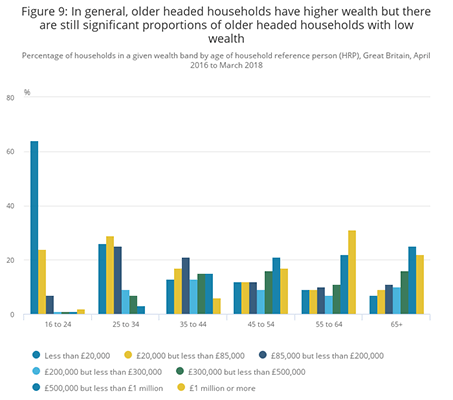
It breaks down the average net worth of a household based on the oldest person responsible for household affairs.
If we refer to the youngest bracket 16-24, we can see that the highest percentage of households have a net worth less than £20,000.
In the 25-34 bracket this then changes to £20,000-£85,000.
In the 35-44 bracket this then increases again to £85,000-£200,000.
What makes up a households net worth changes as the household gets older, and can be broken down into 4 sections – physical wealth, property wealth (net), pension wealth and financial wealth (net):
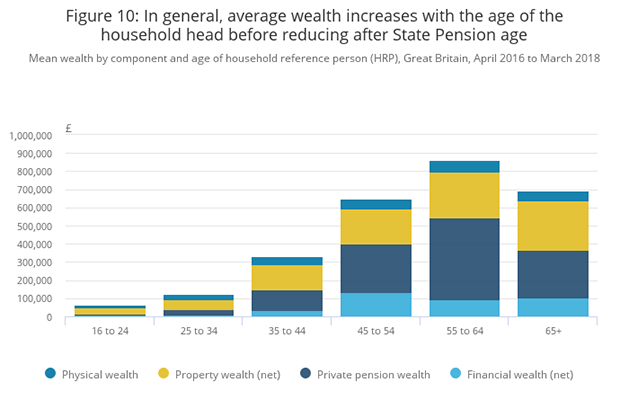
If we refer to the yellow section in each column, this shows property wealth. As the household gets older the property net wealth increases. This could be due to moving from an apartment in your 20s to a house in your 30s to start a family, to finally paying off the mortgage.
We can see that on average the younger the individual, the lower their net worth in all 4 sections. This is because net worth tends to increase as we age because we buy a property, have a full-time job to begin saving or investing and start a retirement fund etc. Whereas in the 16-24 bracket most are either still in full-time education with no employment living at home, or at University with a student loan or working part or full-time.
Our retirement funds grow a little more in each column as we add to the fund through our employment, however from 65+ onwards our retirement fund then starts to deplete as we begin retirement.
More useful business calculators: