19+ Top Live Chat Statistics For 2024: Usage, Demographics, Trends
Curious about the latest live chat statistics? We’ve got you covered.
Businesses are constantly transforming and finding new ways to support their customers. Live chat is one of the more recent customer communication options that many businesses are implementing.
Live chat tools offer a quick and efficient way for customers to get the support they need without having to go to too much effort. No more waiting in call queues or waiting 14 days for a response to an email.
Instead, customers can have their questions answered and their issues ironed out in a matter of minutes, all without picking up the phone or leaving your site.
Unsurprisingly, live chat is fast becoming a standard feature of B2B sites and B2C businesses are also beginning to jump on the hype – but should you join them?
To help you to decide, here are some of the most important live chat statistics you need to know. The stats below will tell you everything you need to know about the state of live chat this year and help you to stay ahead of the game when it comes to supporting your customers.
Editor’s picks
- The live chat industry is expected to be worth $997 million by 2023. (WhosOn)
- 61% of businesses currently using live chat are B2B. (Zoho)
- The average live chat duration is 11 minutes 55 seconds. (Comm100)
Live chat usage statistics
Live chat is by no means a new concept, but it’s certainly growing in popularity. Here are some statistics that tell us what types of business are using live chat, and they are using it for.
The live chat industry is expected to be worth $997 million by 2023
Since 2016, the live chat industry has been growing in size with more and more businesses opting for the convenient method of communication. In 2016, the industry was valued at $590 million but this figure is expected to almost double by 2023. (Source: WhosOn)
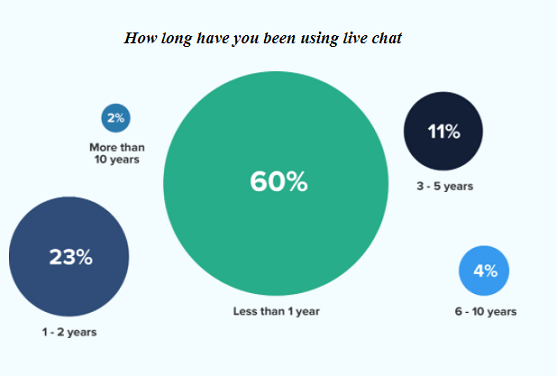
60% of companies have been using live chat for less than 1 year
Although live chat is growing in popularity, many companies have only recently introduced live chat options for their customers. According to a Zoho study, 60% of companies using live chat have only been doing so for a year or less. (Source: Zoho)
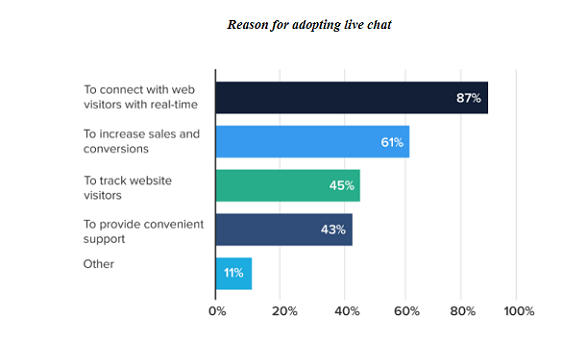
87% of companies use live chat to connect with consumers in real-time
The main reason businesses choose to implement live chat support is to connect with their customers in real-time. Customers hate waiting, and live chat provides businesses with the option to reduce wait times and give one-to-one real-time support. (Source: Zoho)
61% of companies use live chat to boost sales and conversions
The second most popular reason for using live chat is conversions and sales. 61% of companies reported that the main reason they used live chat in order to boost conversion and sales. (Source: Zoho)
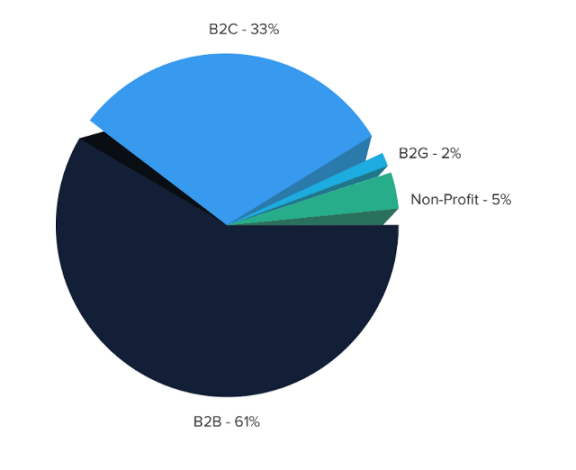
61% of businesses currently using live chat are B2B
Although live chat is popular with all types of businesses, it’s been adopted widely by B2B businesses, and they make up around 60% of live chat users. Despite B2C businesses generally having much higher customer support budgets, they’ve been much slower to adopt live chat as a means of communication. (Source: Zoho)
Live chat customer satisfaction statistics
Live chat is a great way to keep your customers happy and give them rapid support and an efficient point of contact. Here are some statistics that show the effect live chat can have on your customer’s experience.
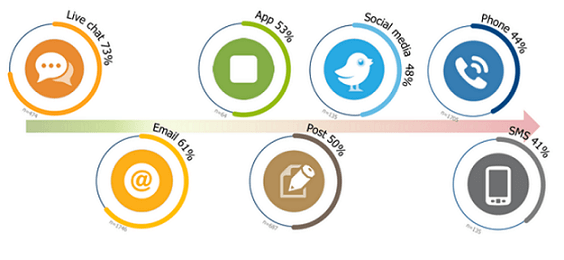
Live chat has the highest satisfaction rates of all communication methods
According to a study from eConsultancy, live chat is extremely popular with customers. The results of the survey showed that live chat has a 73% customer satisfaction rate, as opposed to email which has a 66% satisfaction rate. (Source: eConsultancy)
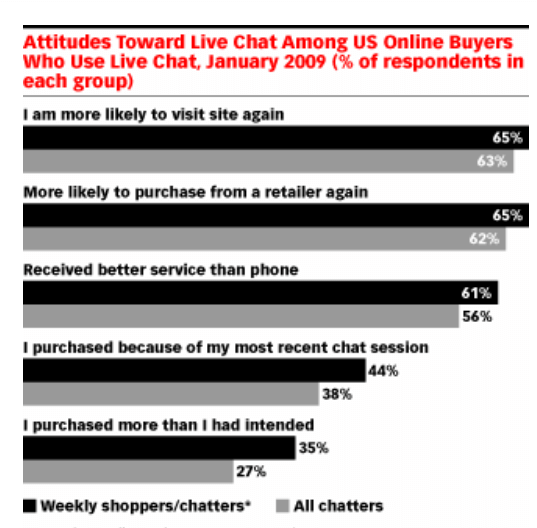
65% of consumers are more likely to return to a site that features live chat options
According to a study by eMarketer, live chat features are great at turning first-time customers into return customers. Customers are so fond of live chat, that having a live chat option actually plays a huge part in whether or not the customers would return to the site. (Source: eMarketer)
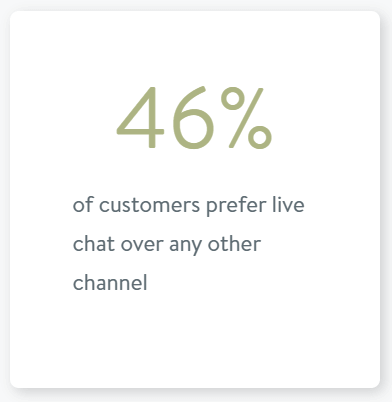
46% prefer live chat to any other communication channel
According to Kayako, live chat is one of the most popular types of communication for customers. Just under half of the consumers prefer live chat to other contact options such as email and telephone support. (Source: Kayako)
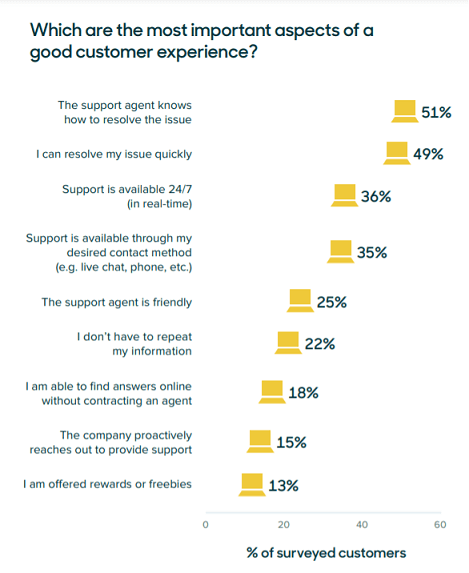
36% of customers said it was important to them that businesses had support available through ‘desired methods’ like live chat
In a 2019 study, Zendesk found that having ‘desired methods’ of contact available such as live chat was the 3rd most important aspect of a good customer experience. 36% of customers reported that having support available through their desired contact method was extremely the most important thing to them. (Source: Zendesk)
The takeaway: Diversify your contact methods so you don’t lose out on customers that prefer not to talk on the phone.
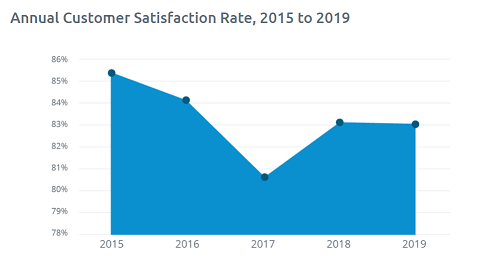
83% of customers said they were at least ‘somewhat satisfied’ with live chat support in 2020
This figure has dropped slightly since 2018. Despite more businesses adopting live chat, Comm100’s 2020 report showed that customers have been becoming less and less satisfied with live chat service since 2015.
This could be because customer expectations have grown in tandem with live chat usage, or because higher demand for live chat services has led to a drop in the quality of customer service. (Source: Comm100)
Live chat benchmark statistics
How do you measure the performance of live chat teams? By comparing your performance to industry-wide benchmarks, of course! The benchmarks below are all taken from the 2020 Comm100 live chat benchmark report. How do you stack up against them?
The average live chat wait time is 46 seconds
Chatbots aren’t yet perfect and can’t always handle every query without the help of an agent. When a customer needs to speak to an agent via live chat, the average length of time it takes them to pick up is 46 seconds. (Source: Comm100)
Interestingly, wait time correlates strongly with customer satisfaction – but not in the way you might think. Organizations that have a higher customer satisfaction score (90%+) have average wait times of 1 minute 32 seconds, compared to 30 seconds amongst those with CS scores of less than 90%.
12. The average live chat duration is 11 minutes 55 seconds
This is the average length of time it takes a chatbot/live chat agent to resolve the customer query. Ultimately, though, there’s no ‘ideal’ time to aim for here. The chat needs to be as long as it needs to be to adequately answer the customer’s question. (Source: Comm100)
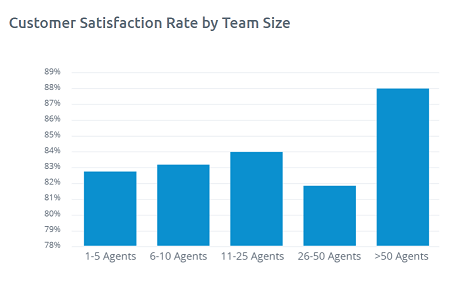
Live chat teams with >50 agents perform better when it comes to customer satisfaction
According to the Comm100 report, the key to keeping customers satisfied with your live chat support is having more agents in your live chat. Larger teams make for more sophisticated and extensive live chat support, which keeps customers feeling supported and happy during live chat interactions. (Source: Comm100)
Canned messages are becoming less popular, decreasing by 9% since 2018
As live chat grows in popularity, businesses are aiming for more personalized interactions with customers, which led to a natural decrease in the overall usage of canned messages. Despite this, canned messages still have their place, and well written canned messages with a personal element can offer businesses a time-saving option. (Source: Comm100)
Live chat conversion and lead generation statistics
Live chat isn’t just about customer support, it’s also a powerful tool for guiding customers through your funnel and driving sales. Here are some statistics about the effects that live chat can have on lead generation and conversion rates.
38% of consumers reported that a live chat session led them directly to a purchase
This statistic shows us how important live chat can be when it comes to guiding customers through your sales funnel. If customers can receive on-demand support during the purchase process, they’re more likely to complete the purchase and not abandon it altogether. (Source: Vital)
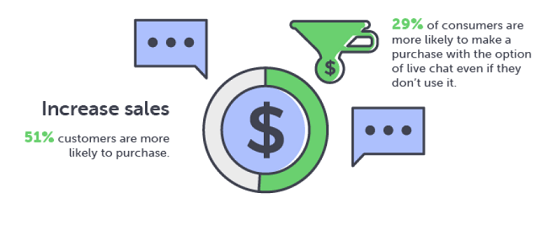
29% of customers are more likely to make a purchase from a site with live chat, even if they don’t need support
Martech Zone evidenced that live chat is important to customers even if they don’t need support. 29% of customers said they were more likely to purchase from sites that feature live chat even if they don’t need to use it.
The takeaway: Making support easy to access can help make your business seem more trustworthy and encourages conversions. (Source: Martech Zone)
51% of consumers reported they were more likely to make a purchase after using live chat
The same study from Martech Zone showed that over half of customers were more likely to make a purchase after receiving live chat support. Live chat gives customers the option to ask questions and receive support right away, and this makes them less likely to drop out of your funnel due to lack of support. (Source: Martech Zone)
Adding live chat to your site can improve conversion by as much as 12%
According to LTV plus, implementing live chat can have a dramatic impact on conversions. The same study showed that customers that utilize the chat are 2.8x more likely to convert. (Source: LTV Plus)
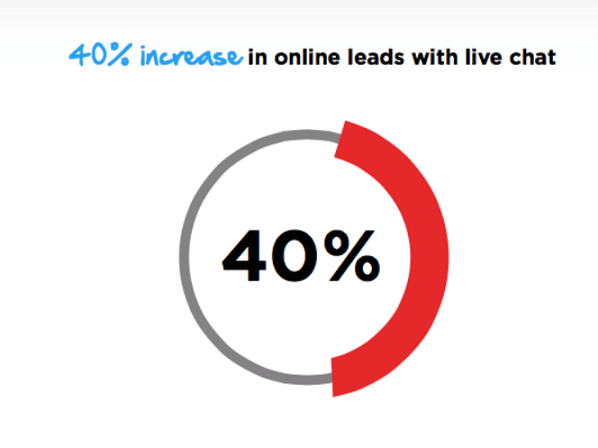
Live chat can increase leads by 40%+
Live chat is equally important when it comes to lead generation. According to industry thought leader Neil Patel, live chat can increase lead generation rates by 40% or more. (Source: Neil Patel)
Wrapping it up
And that wraps up our roundup of the latest live chat statistics, facts, and trends.
Want to dig into more of our statistics articles? I’d recommend checking out these: