38 Instagram Statistics For 2024: The Definitive List
Want to learn more about the state of Instagram this year?
We’ve updated our roundup of Instagram statistics with fresh new data pulled from the latest industry reports and surveys.
Read on to find out how many people are using Instagram this year, the ways they’re using it, and the trends that are shaping the platform.
Editor’s top picks
- Instagram has around 2 billion monthly active users… (We Are Social)
- …Which makes it the third most-used social media platform (We Are Social)
- Instagram’s revenue last year was estimated to be around $51.4 billion (Business of Apps)
- Users spend 12 hours per month on Instagram, on average (We Are Social)
- 90% of Instagram users follow at least one brand (BloggingWizard)
- 80% of marketers use Instagram (Social Media Examiner)
- 56% of marketers plan to devote more time/effort to Instagram this year (Social Media Examiner)
- The average Instagram engagement rate is 6.01% (HubSpot)
- 50% of Instagram users have 1-10k followers (HubSpot)
- India has more Instagram users than any other country (Statista2)
General Instagram statistics
Let’s start by looking at some general Instagram statistics that reveal just how popular Instagram is and the space it holds in the wider social media landscape.
1. Instagram is the third most used social media platform in the world
Well, technically it’s actually joint third as it shares that position with WhatsApp. Both have around 2 billion monthly active users (MAUs) globally.
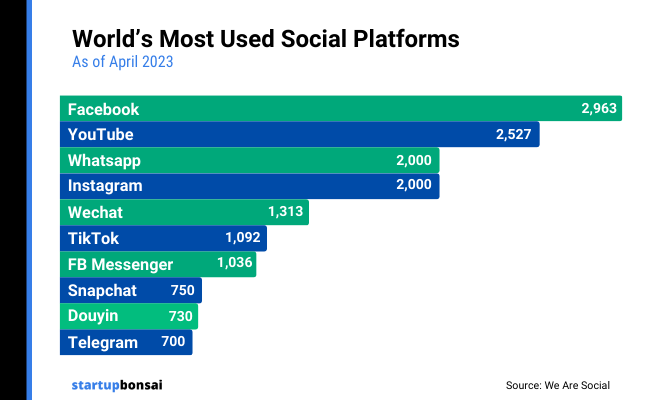
That puts Instagram behind Facebook (2.9b+) and YouTube (2.5b+), above all other social platforms.
Also, it’s worth pointing out that not everyone agrees that YouTube can accurately be categorized as a social platform. And if we take YouTube out of it, Instagram would actually be the second most popular social media platform in the world.
Source: We Are Social
2. Instagram has an advertising audience of 1.32 billion
This is the total potential reach of ads on the platform. The reason it’s less than the total number of MAUs is that not everyone who uses Instagram can be served ads.
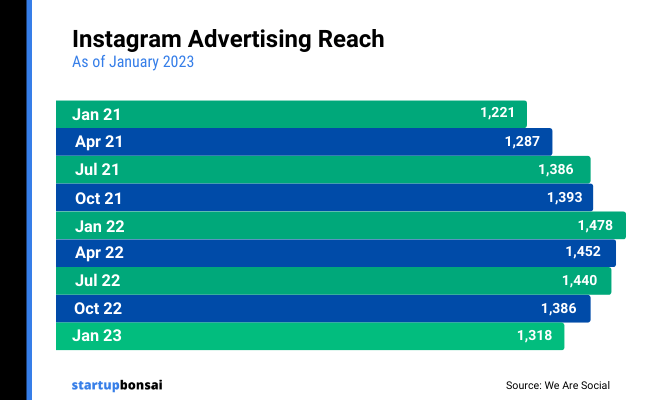
Notably, while Instagram’s ad reach was rising throughout 2021, it began dropping sharply in 2022, and was down by 10.8% or 160 million YoY as of the latest We Are Social report.
Instagram Stories ads have a reach of 959.7 billion, which is 72.8% of IG’s total advertising reach, and Reels Ads have a reach of 726.8 million, which is 55.1% of IG’s total advertising reach.
Source: We Are Social
3. Instagram is the fourth most visited website in the world
According to data from Similarweb, there were 6.8 billion total visits to Instagram.com across desktop and mobile over the last month (at the time of writing). Only Google, YouTube, and Facebook get more monthly website visits.
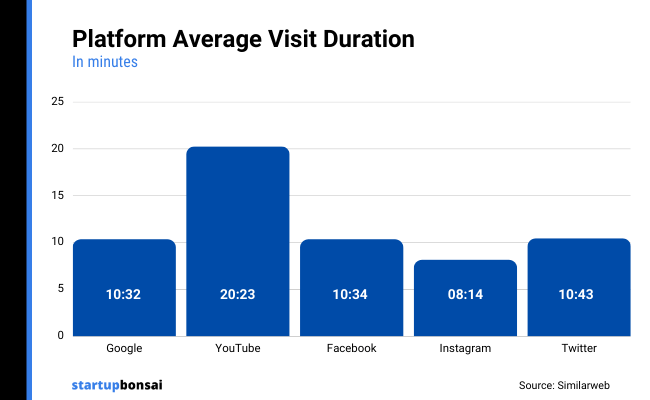
The average duration of those website visits is a little over 8 minutes, and the average website visitor opens 10.89 pages before they leave.
Source: Similarweb
4. ‘Instagram’ is the 10th most common Google search query in the world
This is according to data from last year published in We Are Social’s latest report.
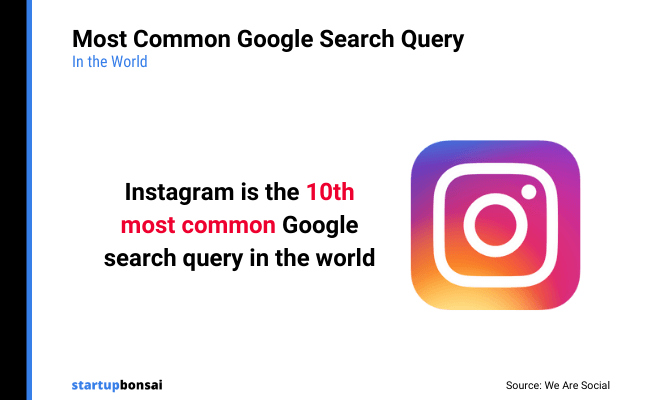
We don’t know exactly how many ‘Instagram’ Google searches there were as Google doesn’t publish that data, but we do know it was 12% more than the year before, and that searches were up 42% over the last 5 years.
Source: We Are Social
5. Instagram is the world’s second favorite social media platform
Instagram might only be the third most used social media platform, but it’s the world’s second favorite.
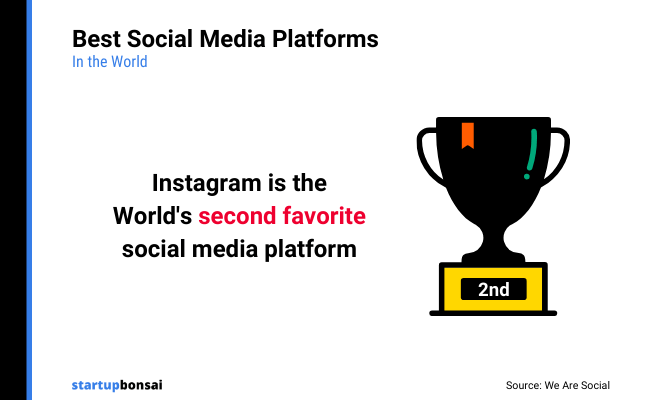
According to survey data, 14.3% of active social media users say Instagram is their favorite platform, which puts it above its bigger brother Facebook (14.2%) in the global popularity contest. Only WhatsApp was more widely liked (15.8%).
Source: We Are Social
6. Instagram made around $51.4 billion in revenue last year
This is according to industry estimations as unfortunately, Meta doesn’t disclose its Instagram revenue. It’s up from $47.6 billion the year before.
If these estimations are correct, that means Instagram is responsible for around 44% of parent company Meta’s total revenue in 2022. And it may even surpass Facebook as the main revenue source for Meta within a couple of years.
Source: Business of Apps
Instagram usage statistics
Now we know how many people use Instagram, let’s look at some statistics that tell us more about the ways in which they use it.
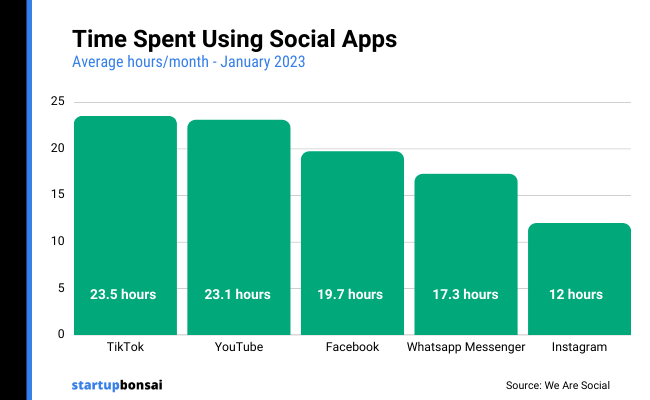
7. The average user spends 12 hours per month on the Instagram app
This is up by 46 minutes (6.9%) year over year. While impressive, 12 hours per month is still significantly lower than the average social media user spends on YouTube (23h+), Facebook (19h+), WhatsApp (17h+), and TikTok (23h+).
It’s also worth noting that there’s significant regional variation when it comes to time spent on the app. Turkey has the highest average time spent using Instagram at 21.4 hours per month, while South Korea has the lowest at 6.1 hours per month.
Source: We Are Social
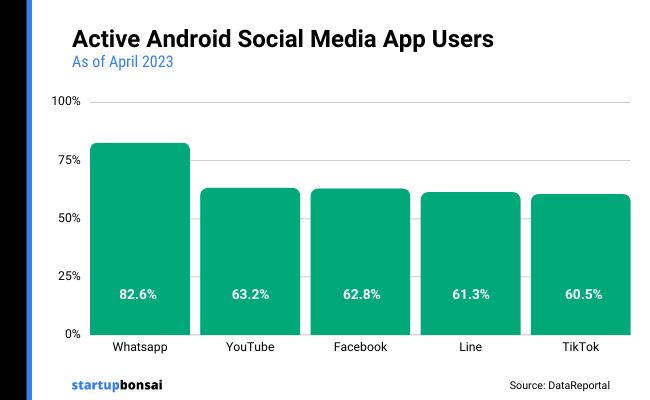
8. 58.5% of Instagram users open the app every day
This is according to data from users of the Android app. While a daily usage rate of 58.5% is definitely impressive, it’s still less than WhatsApp (82.6%), YouTube (63.2%), Facebook (62.8%), and TikTok (60.5%).
Source: DataReportal
9. 60.9% of Instagrammers use the app to research brands and products
As part of their latest report, We Are Social and Meltwater looked at how often social media users follow or research brands on social media.
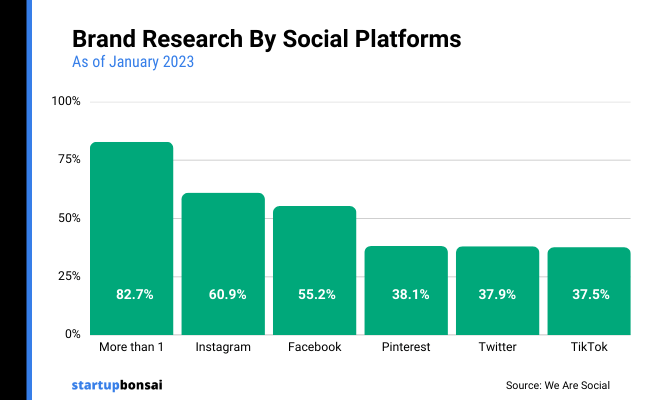
They found that a higher proportion of Instagram users do so than any other social media network.
Over 60% use Instagram to research brands and products, compared to 55.2% on Facebook, 38.1% on Pinterest, 37.9% on Twitter, and 37.5% on TikTok. This is good news for IG marketers.
Source: We Are Social
10. 69% of Instagram users say they mainly use the platform to post/share photos and videos
This makes it Instagram’s number one activity/use case. The next most commonly-cited reason for using Instagram was ‘to find funny/entertaining content’ (66%), followed by ‘to follow/find information about brands and products’ (58%).
Source: GWI
11. 90% of Instagram users follow brands
This is more good news for marketers. The vast majority of Instagram users follow at least one business account, so it isn’t as tough for brands to grow their organic following on Insta as it is on some other social media platforms.
Source: Blogging Wizard
12. 69% of Instagrammers say they post their own content to the platform
Instagram users aren’t just passive consumers of content—they’re creators.
Over two-thirds of Instagram users regularly share their own content. To put that into perspective, only 26% of TikTok users post their own content.
Source: GWI
13. The number of Instagram users that watch or upload Reels is up 46% since Q1 2021
Unsurprisingly, given the meteoric rise of the short-form video format, usage of Instagram Reels has increased dramatically over the last couple of years. It’s already up by 46% since the first quarter of 2021, and I suspect it’ll keep climbing. That said, Reels is still facing steep competition from the likes of TikTok and YouTube Shorts.
Related Reading: Top Instagram Reels Statistics You Need To Know
Source: GWI
14. 50% of Instagram users say they most want to see ‘funny’ content
A survey by GWI asked users of Instagram what type of content they most want to see on the platform, and around half of them pointed to ‘funny content’, making it the number one most popular response.
A further 46% said they’d like to see ‘creative content’, and 41% pointed to ‘informative content’.
Source: GWI
15. 500 million people use Instagram Stories daily
Instagram Stories is an in-app feature that allows users to share photos or videos with their followers via their Instagram Story, which will automatically disappear 24 hours later. It’s a very popular format on Instagram and over half a billion people now use Stories every day.
Source: ProfitBlitz
Instagram user demographics
Next, let’s look at some Instagram statistics that tell us more about the demographics that make up the platform’s user base.
16. India has 229 million Instagram users
This makes India the country with the number one largest Instagram audience. The US comes second with 143.35 million Instagram users, and Brazil takes third place at 113.5 million.
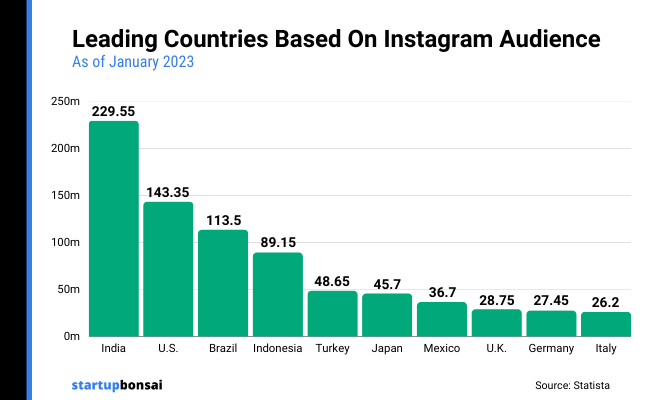
Population size may be playing a part here. After all, India has a population of 1.428 billion—-the largest in the world. China has a similarly-large population, but as Instagram is banned in China, it doesn’t make the top 5 countries by Instagram users.
Source: Statista2
17. 57.2% of geotags on Instagram fall in the Americas
While India has the most Instagram users, most Instagram posts are tagged in the Americas. Europe comes second, accounting for 30.1% of geotags. Asia only accounts for 7.3% of geotags; Oceania accounts for 2.9%, and Africa for 2.6%.
Source: HubSpot
18. 30.8% of Instagram’s global audience falls between the ages of 18 and 24.
A further 30.3% are aged 25 to 34, and 8% are aged 13 to 17. So all in all, over two-thirds of Instagram’s global addressable ad audience is under 34 years old.
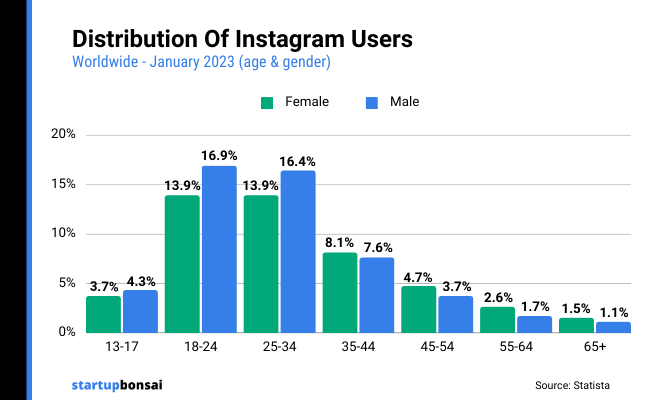
In comparison, only 2.6% are over the age of 65. No doubt about it, Instagram is a young person’s platform.
If we break it down by gender, there also seem to be more male Instagram users than females globally, at least in the under-34 group.
Source: Statista3
19. 27.4% of Instagram users in the US fall between the ages of 25 and 34
This makes 25-34 the number one largest Instagram audience segment by age in the US.
A further 25.1% of US Instagram users are aged 18 to 24, and just under 6% are aged 13 to 17. So overall, we can say that well over half of all US Instagram users are under 34. In comparison, only 5.2% are over 65.
Source: Statista4
20. 82.1% of Instagram users also use Facebook
This makes Facebook Instagram’s number one cross-over platform in terms of audience overlap. And that isn’t all that surprising, given that both platforms are owned by Meta.
A big chunk of Instagram users also use other platforms like WhatsApp (75.1%), YouTube (74.9%), Twitter (54.8%), and TikTok (54.2%). But comparatively few use Reddit (15.2%). And only 0.2% of Instagram users are unique to the platform.
Source: We Are Social
Instagram follower statistics
Here are a handful of interesting statistics about Instagram followers.
21. The most followed account on Instagram is… @Instagram!
Instagram’s own brand profile has over 650 million followers, making it the number one profile by followers.
Next is Christiano Ronaldo (@Cristiano) with almost 600 million followers. And rounding out the top 5 are @leomessi (482 million), @selenagomez (427 million), and @kyliejenner (398 million).
Source: Instagram
22. 36% of the top 50 most-followed Instagram accounts belong to musicians
This makes ‘Musician’ the most followed type of account on Instagram.
‘Actor’ and ‘Sportsperson’ both come in joint second place, each of which makes up 14% of the most-followed accounts.
While brand accounts came in third place (making up 12% of the global top 50 Instagram accounts by followers), it still stands that almost all of the most-followed accounts on Instagram are celebrities and public figures—bad news for Instagram marketers.
Source: HubSpot
23. Around 50% of Instagram accounts have between 1k and 10k followers
49.9%, to be exact. A further 26.4% of accounts have under 1k followers, and virtually no one has under 100 followers. This means that only a quarter of all Instagram accounts have over 10k followers.
Source: HubSpot
24. Only 0.6% of Instagram accounts have over a million followers
It’s tough to break the million milestone on Instagram, and only a tiny fraction of users have managed to get there.
It’s a little easier to reach 500k followers, as 3.9% of Instagram accounts have reached that mark. A further 3.2% have reached 100k followers, and 15.2% have reached 50k followers.
Source: HubSpot
Instagram engagement statistics
How many likes, comments, and shares should you be aiming for per post on Instagram? Let’s find out by taking a look at some Instagram engagement statistics.
25. The average global engagement rate on Instagram last year was 6.01%
Or around 1147 engagements per post.
That’s up from 5.86% in 2021. However, 2021’s average engagement rate was nearly double the year before, so this year’s comparatively small increase might actually suggest that engagement rates are starting to level out.
Source: HubSpot
26. APAC has one of the highest average Instagram engagement rates at 9.63%
Average engagement rates on Instagram vary when we look at regional figures.
In the Asia-Pacific region, engagement is much higher than the global average—9.63%, on average.
In North America, it’s just a little higher than the global average at 6.5%. And in the UK & Ireland, it’s below the global average at 5%.
Source: HubSpot
27. Videos get more engagement than other types of Instagram content.
Instagram videos get over 30 comments and over 1800 likes, on average. In comparison, Carousel posts get less than 25 comments and 1500 likes. And image posts get less than 15 comments and 600 likes on average.
Source: HubSpot
28. Posts with captions of less than 20 characters get the most engagements
HubSpot’s latest study didn’t find that captions have a huge impact on engagement rate as, regardless of the length, average engagement rates tend to hover somewhere between 5 and 7%.
However, posts with 20 characters or fewer in their captions achieved an average engagement rate closer to the top end of that range. While those with no caption, or captions between 1k and 2k characters long, were towards the bottom of the range.
Including emojis in your captions also seems to give a small boost in engagement. Posts with 1-10 emojis have a higher average engagement rate than those with no emojis or too many emojis (11+).
Source: HubSpot
29. Posts with 11+ hashtags have the best engagement rates
When it comes to hashtags, it looks like perhaps less isn’t more.
HubSpot’s study found that posts with over 11 hashtags generated engagement rates of over 7%—higher than those with any other number of hashtags.
Those with 4 hashtags also performed above average, suggesting this may be a sweet spot to aim for if you don’t want to go overboard.
Source: HubSpot
30. 8pm is the best time to post for engagements
HubSpot also looked at how the average engagement rate on Instagram varies across the day, and found that it peaked at night from around 6 pm to 3 am.
8 pm had an average engagement rate of 7.33%, which made it the best hour to post. Midnight also did particularly well. On the other end of the spectrum, engagements were lowest at 8 am (5.53%).
HubSpot also found that Sunday had the highest average engagement rate of any day of the week.
Source: HubSpot
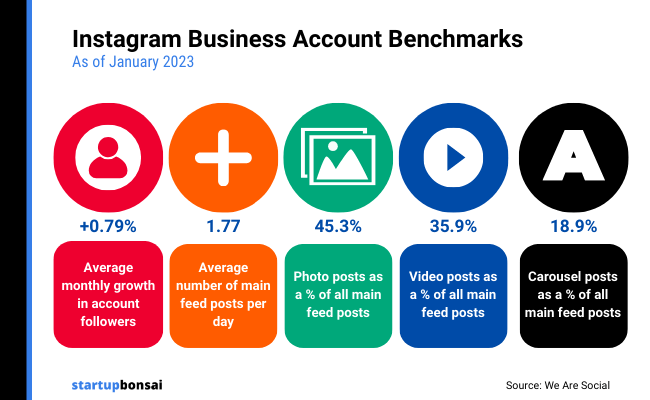
31. The average Instagram business account shares 1.77 posts per day
Of those, 45.3% of those are photo posts, 35.9% are video posts, and 18.9% are Carousel posts.
The takeaway: 1-2 posts a day is a good benchmark for brands that are active on Instagram to aim for.
Source: We Are Social
32. The average Instagram business account achieves a 0.79% monthly growth in followers
This is a very modest growth rate and shows you don’t necessarily have to gain thousands of new followers a month to be performing above average. Slow and steady growth is much more achievable.
Source: We Are Social
Instagram marketing statistics
Last but not least, let’s take a look at some Instagram statistics related to marketing.
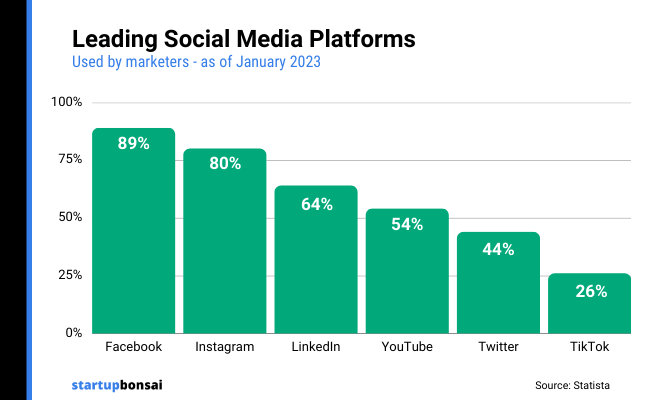
33. 80% of social media marketers use Instagram
According to a global survey, four-fifths of marketers promote the businesses/brands they work for on Instagram. This makes it the second most popular social media marketing channel after Facebook (used by 89% of marketers).
While 80% is the average, slightly more B2C marketers use Instagram (84%), and slightly less B2B marketers (74%).
Source: Statista1, Social Media Examiner
34. 22% of marketers say Instagram is the most important social platform
When asked what the most important social media platform was for their business, almost a quarter (22%) of surveyed marketers pointed to Instagram. Only Facebook had more votes (45%).
Source: Social Media Examiner
35. 56% of marketers plan on increasing their organic Instagram efforts over the next year
This makes Instagram the top social media platform where marketers plan on doing more. In addition to the 56% that plan on increasing their IG efforts, a further 31% said their activities would stay the same, while only 5% said they would decrease, and only 8% said they don’t have any plans to use Instagram.
Source: Social Media Examiner
36. 53% of marketers use Instagram to regularly publish video
This makes Instagram the second top video marketing channel after Facebook (55%). Interestingly, more marketers said they use Instagram to post videos than dedicated video platforms YouTube (48%) and TikTok (20%).
Source: Social Media Examiner
37. 52% of marketers run ads on Instagram
This makes Instagram the second most used social platform for advertising behind Facebook (67%).
Of the 52% of marketers that run ads on Instagram, 24% say they do so often and 28% said they only sometimes run Instagram ads.
Source: Social Media Examiner
38. 25% of social media marketers say Instagram is the platform that drives the most sales
This makes Instagram the second top platform for driving sales, behind only Facebook (34%) but above LinkedIn, YouTube, TikTok, and Twitter.
A further 76% of social media marketers said Instagram boosts exposure, 45% said it drives traffic, and 37% said it helps build brand loyalty.
Source: Social Media Examiner
Sources
Final thoughts
There you have it—38 Instagram statistics to inform your strategy this year.
As these stats show, Instagram continues to be one of the most popular and successful social media platforms among both marketers and consumers.
But it’s also changing. Reels and short-form videos generally are becoming a more important part of the platform, and marketers should make sure they’re incorporating video into their Instagram content mix if they want to continue to drive the best possible results
Looking for more statistics like these? Check out the posts below: